How I made the graph
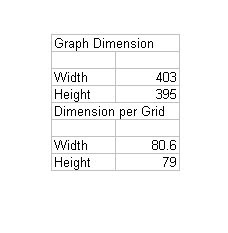
1. The total dimension was measured using the Create a Line button in the Tool Box.
2. The obtained dimension was divided by the number of data points in the X- and Y-axis.
 3. Using the mouse pointer, the location of the origin and of the data points were determined.
 4. The origin was subtracted from each data point position.
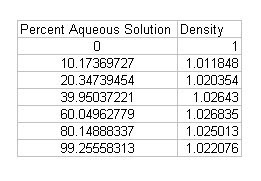
5. Using the following formula, the physical value of each data points were obtained.


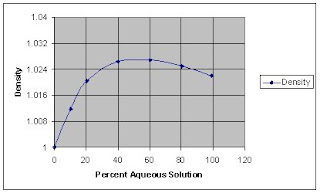
6. Using the Chart options, the obtained data were plotted.

I rate myself 9 out of 10 for the effort in this activity.
1 comment:
Hi Aileen,
Looks similar! But I'll give you a 10 if you can overlay them. Just make sure you crop the scanned image such its origin coincides with the lower left corner of the image. When you overlay, their origins should coincide.
Post a Comment